
$SIREN sudden move forced me to add this token in my watch.
From ~$0.13 to ~$0.60, that is nearly a 5x move, not a normal bounce, so I checked on-chain, derivatives, and structure to understand what is actually happening behind this move.
SIREN already completed a full cycle, moving from around $4.8 down to ~$0.13 with a ~97% crash, and now stabilizing around $0.55–$0.60. This is not a clean uptrend and not a dead chart either, this is what I see as a repositioning phase where both buyers and sellers are preparing for the next move.
On-chain data made things more intresting. During the pump, 3.8M, 15.7M, 4.9M, and 7.8M SIREN were moved from KuCoin and Gate cold wallets to hot wallets, which is more than 32M SIREN unlocked and ready for selling. At the same time, Binance proxy moved funds to a cold wallet starting with 0x2555…, and that wallet is still holding a multi-million dollar position with no major outflow. So one side is holding while another side prepared supply, and that balance is why price is not trending strongly.
Derivatives data also supports this view. Open interest expanded agressively during the pump and then dropped sharply, confirming liquidations already happened. Now OI is relatively flat around the ~$60M–$80M range, which means the market has reset. Earlier the market was long-heavy and those longs got wiped, and now there is a slight short build forming while volume is cooling, showing no strong buyers yet, only positioning.
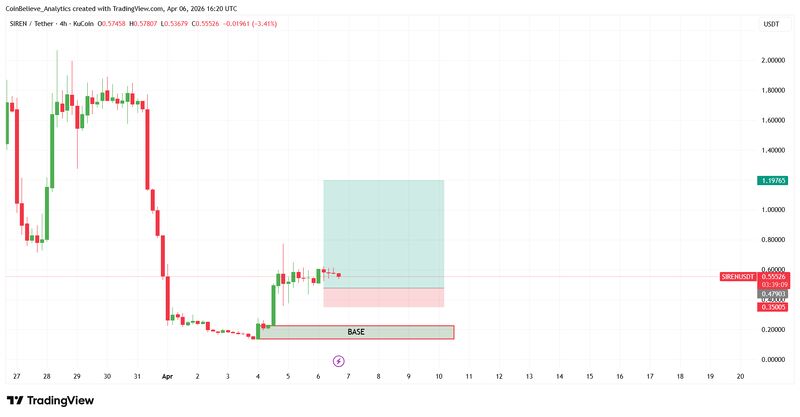
From a 4H chart perspective, the structure is very clear. There was a sharp drop, followed by a strong bounce, and now price is moving sideways just below resistance. This is compression, not a breakout, and usually compression leads to expansion.
Liquidity helps identify direction. There is liquidity above the price around $0.62, $0.66, and $0.70, while below the price liquidity sits around $0.55 and $0.50. On the higher timeframe, a larger cluster exists around $0.9 to $1. Since price tends to move toward liquidity, the upside is currently slightly more attractive.
So the setup becomes clear. Price is sitting around $0.58 below resistance, shorts are slowly building, and liquidity is stacked above. If price moves slightly higher, those shorts can get liquidated, creating a short squeeze and pushing price further.
The path looks structured. First a move toward $0.62–$0.66, then a test of $0.68–$0.72. If the move is weak, price can fall back toward $0.55–$0.50. If strong, it can push toward $0.80.
The key level is $0.80. If SIREN breaks $0.80 with strong volume and rising open interest, resistance above becomes thin, opening a path toward $0.90 and $1, and even $1.1–$1.2 in extension because liquidity exists there.
Timing wise, this is not a one day scalp. This is a short-term setup of a few days to around a week. Right now is compression, the next 1–3 days can act as a trigger, and the following days decide expansion or rejection.
My current lean is slightly bullish for this short-term window because upside liquidity is closer, shorts are building, and the market has already reset. But this is not a strong trend call, and definately not a signal to open blind long positions. This post is focused on the $1 upside path, not the dump scenario.
I already dropped a short and clear version of this on Binance Square. Because of char limit, I will post full depth research on my Coinbelieve website, keep a clean short version on Binance Square, and share the full link inside the MeowArmy chatroom.
This is not a random pump, it is a liquidity-driven structure. Most likely path from here is an upside move first, step by step, and only if $0.80 breaks cleanly does $1 become a realistic continuation.
Data Source: Binance Derivatives Table, Trading VIew Chart, MEXC & CoinCodex Blogs, Coinglass, Arkham Intel
Comments
Login to join the conversation
Sign in