Quick Briefing
- Here's the scoop: Bitcoin's recent dip below $68K wasn't just some random market wobble. It was a direct hit from the latest U.S. jobs report, which basically told the Fed they don't need to cut rates urgently. This pulled the rug out from under liquidity expectations, exposing an already leveraged market where $68K has now flipped from solid support to tough resistance.
- The big picture is, this cooling of rate-cut hopes means less easy money flowing around, and importantly, big institutional players aren't rushing to buy the dip through ETFs. That lack of strong support, combined with lots of leverage still in the system, makes the market structurally unstable and prone to further downside.
- So, here's what to watch: If Bitcoin can't reclaim $68K convincingly, we've got a lot of 'liquidation fuel' below us. Expect potential probes down towards $65K, $63K, and especially $60K as the market tries to flush out over-leveraged long positions. It's not a panic, but near-term, the path of least resistance looks down until that leverage is cleaned up.
Bitcoin’s break below $68,000 was not a random technical event. It was a macro-triggered repricing that exposed an already leveraged structure. The timing matters. The move unfolded immediately after the U.S. jobs report recalibrated rate-cut expectations, and the reaction flowed through futures, ETFs, and derivatives positioning in sequence. When liquidity expectations shift and positioning is stretched, markets don’t need panic to move lower — they move because the structure becomes unstable.
This was not a single-candle event. It was a chain reaction: macro repricing → lower CME open → weak ETF response → elevated open interest → visible liquidation clusters below price.
Jobs Data Triggered the Repricing
The latest U.S. labor report showed payroll growth remaining positive, unemployment holding steady in the low-to-mid 4% range, and wage growth firm enough to prevent any urgency from the Federal Reserve. These numbers do not signal recession stress. More importantly, they do not force immediate rate cuts.
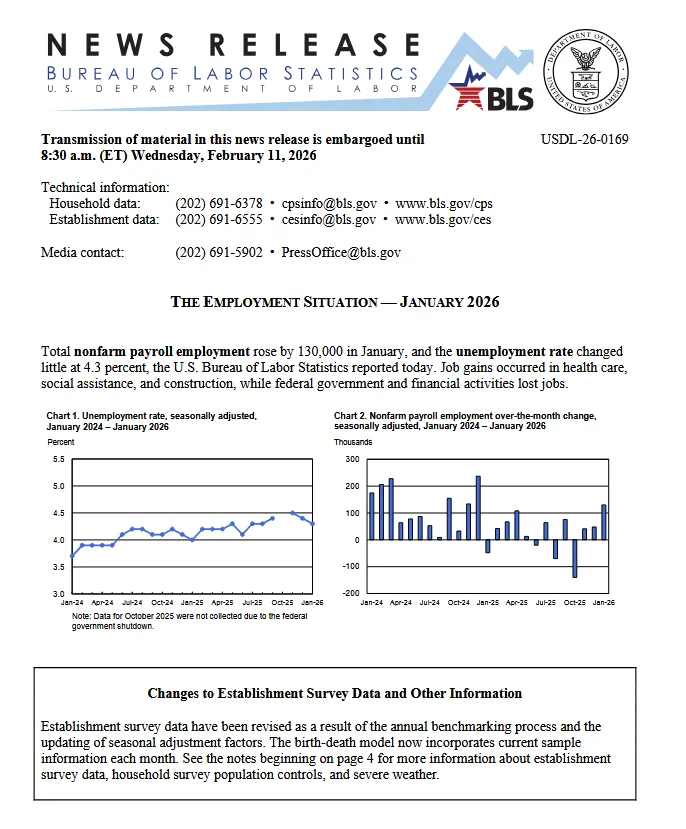
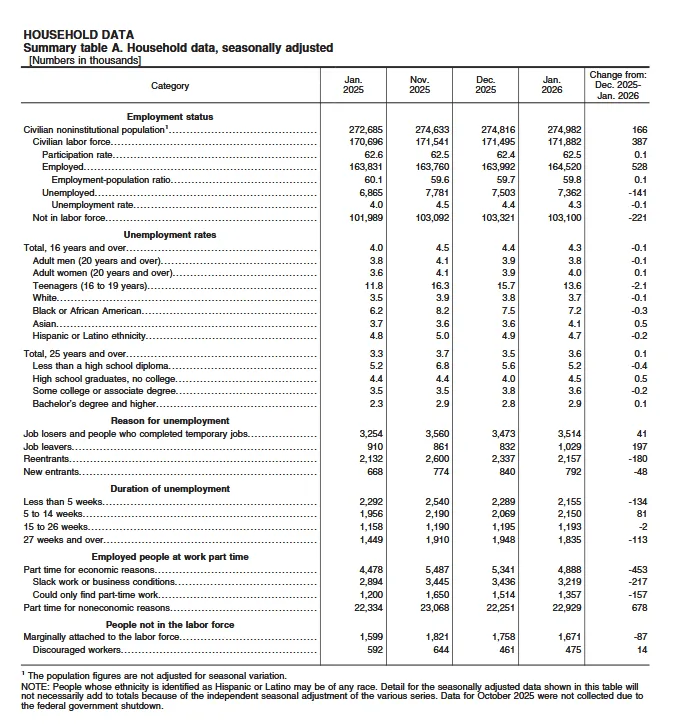
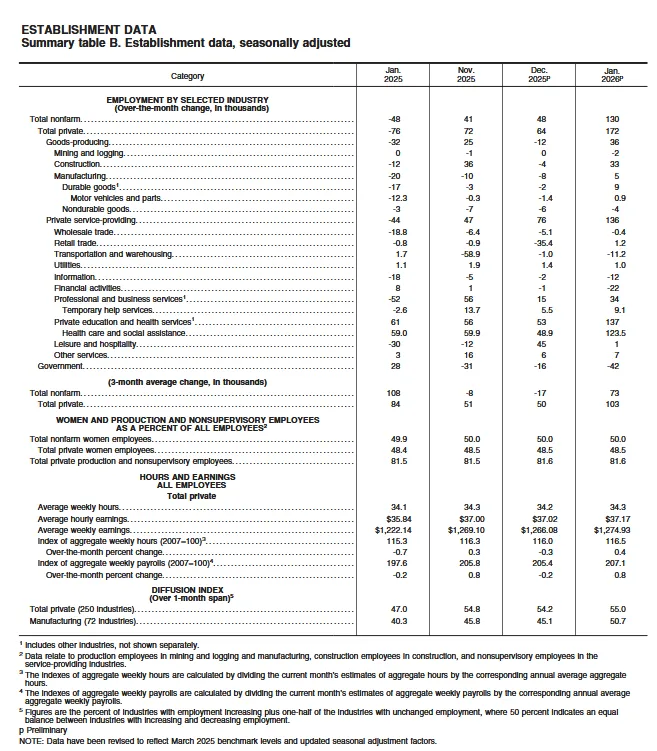
The latest U.S. Bureau of Labor Statistics release showed:
- Nonfarm payrolls increased by 130,000
- Unemployment rate held at 4.3%
- Average hourly earnings rose 0.4% month-over-month and 3.7% year-over-year
For markets that were leaning on a faster pivot narrative, that’s a shift. When rate-cut expectations cool, liquidity assumptions tighten. BTC futures reacted accordingly, opening with a lower CME gap. That lower open wasn’t technical noise — it was macro repricing. Once futures adjusted downward, spot markets followed.
The key macro shift can be summarized clearly:
- No emergency weakness in labor data
- No immediate policy pivot pressure
- Reduced short-term liquidity optimism
When high-beta assets are priced on liquidity expectations, even a small macro recalibration can trigger structural pressure.
ETF Response: Gap Reaction Without Expansion
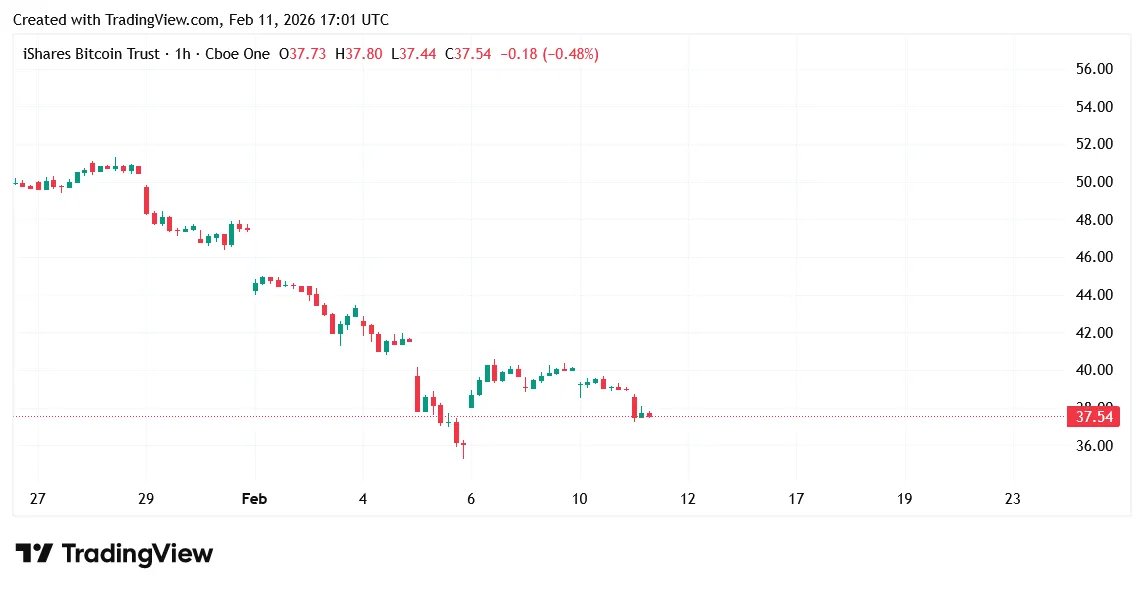
That behavior signals hesitation from spot participants. ETFs represent real capital allocation. When they do not show aggressive dip absorption after a macro-triggered gap, it suggests that institutions are not rushing to defend prior support levels. That absence of strong spot demand increases the influence of derivatives positioning on short-term price direction.
BTC Hourly Structure: $68K Flips From Floor to Ceiling
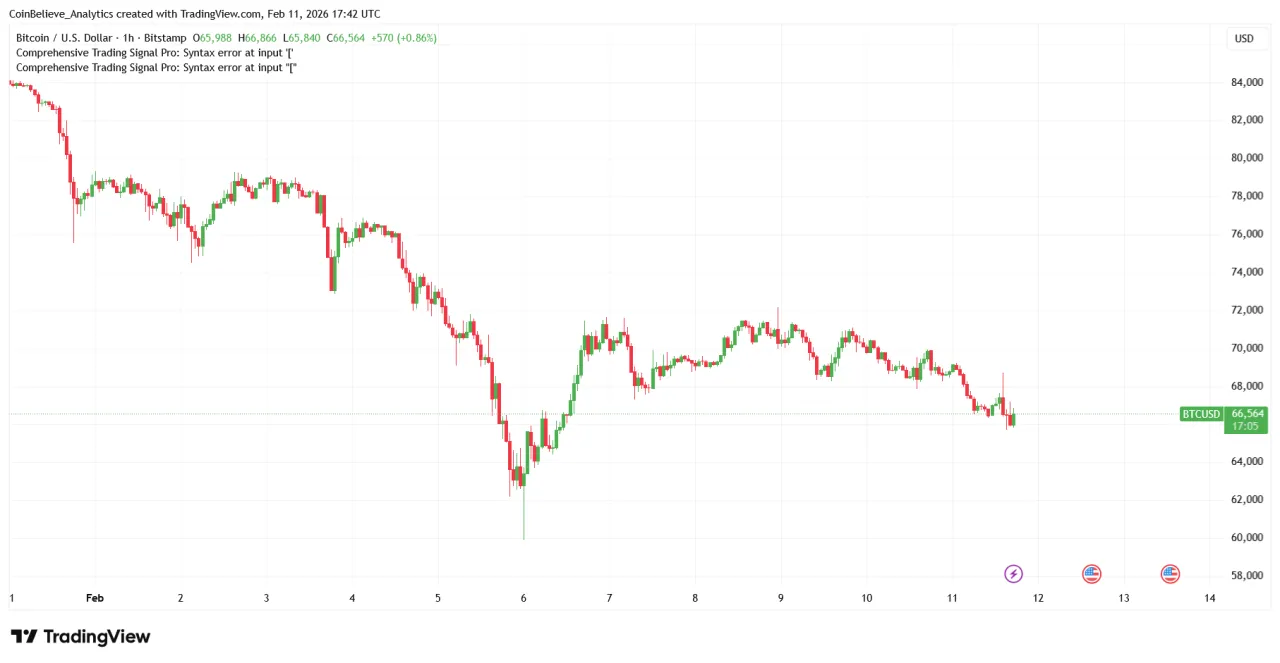
Price is now trading around 66.5K, compressing between resistance at 68K and short-term support around 65K–66K. Importantly, the breakdown did not produce an immediate V-shaped reversal. Instead, the candles show controlled drift — smaller bodies, fading momentum, and no decisive bullish engulfing structure.
- Immediate resistance: 67.8K–68.5K (prior support, now supply)
- Short-term support: 65K–66K (current holding area)
- Major swing support: 62.5K–63.5K (previous consolidation zone)
- Psychological liquidity magnet: 60K (prior extreme wick and high-liquidity level)
Open Interest and Funding: Leverage Still Present
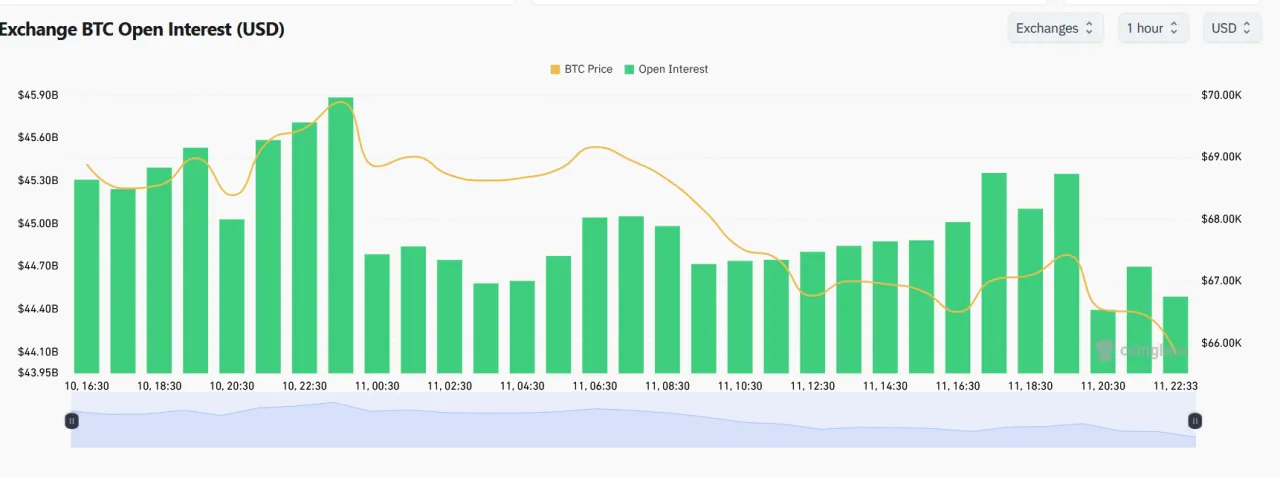
Derivatives positioning remains heavy, with open interest still in the $44B–$47B range. While some reduction has occurred, it does not resemble a full reset. Funding rates have hovered near neutral to slightly negative levels, which suggests traders are still positioning for rebounds rather than capitulating.
- High aggregate OI relative to recent averages.
- No deep negative funding flush.
- Long positioning not fully unwound.
Liquidation Maps: Clear Fuel Between 65K and 60K
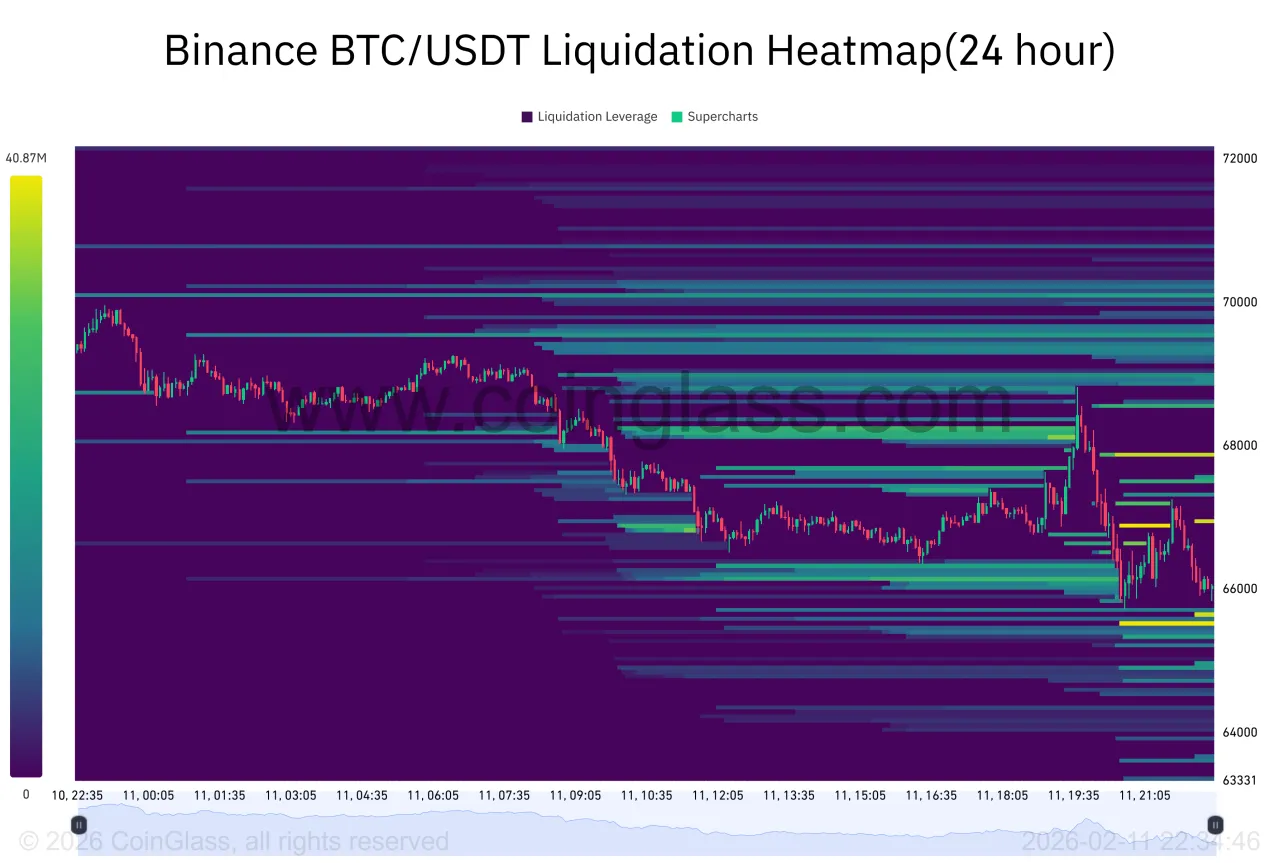
This does not imply a guaranteed collapse. However, when liquidity below price is denser than liquidity above it, the path of least resistance often tilts downward. With leverage still present and ETF absorption muted, the probability of probing those zones increases.
Yield Curve Context: Volatility Environment Expanding
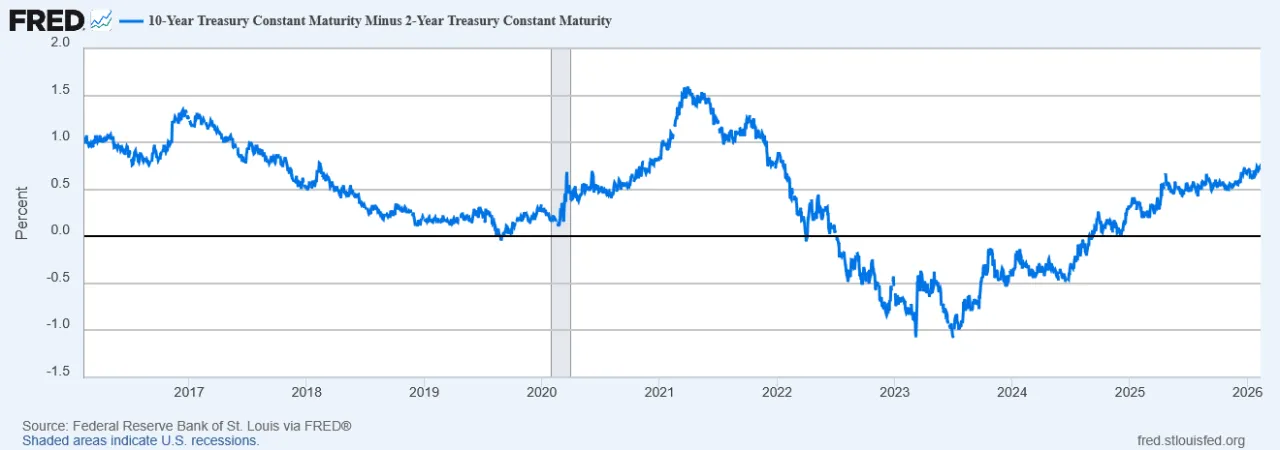
This backdrop does not signal systemic collapse. It does, however, create an environment where leveraged assets respond more sharply to liquidity shifts. BTC, carrying elevated derivatives exposure, is particularly sensitive in such phases.
Final Take: Liquidity Below Remains Unresolved

About Meow Alert
Crypto analyst and researcher with 13k+ followers on Binance Square. Focused on on-chain data and market structure.