
Quick Briefing
- Here's the scoop: In early 2026, crypto isn't booming and it's definitely not crashing like 2022. Instead, Bitcoin is stuck in a volatile, sideways range, consolidating because of tight macro conditions, steady miner selling, and short-term leverage-driven pumps rather than sustained spot buying. It's essentially a "base-building" phase.
- The good news is, this isn't a disaster scenario; strong US equities are actually helping to contain the downside risk. This period is all about patience and strategic positioning, as the real opportunity for a sustained upside trend will only unlock when macro conditions, especially long-term US Treasury yields, finally start to turn lower.
- The key things to watch out for are sticky high bond yields and the constant return of excessive retail leverage, which makes every rally fragile. The market needs clear signs of falling long-term yields, driven by softening economic data and confirmed Fed rate-cut expectations, to truly break out of this consolidation and absorb the ongoing supply friction.
Early 2026 has not produced a sustained upside phase despite ETFs, institutional access, and continuous infrastructure development. Instead, Bitcoin and the broader crypto market remain volatile, range-bound, and highly sensitive to macro data.
This behavior is not random.
It reflects a market operating under macro, structural, and technical constraints at the same time.
Below is a clean breakdown combining chart structure, macro data, and a comparison with the 2022 crash to explain what is really happening.
Bitcoin Chart Structure: Distribution, Not Collapse
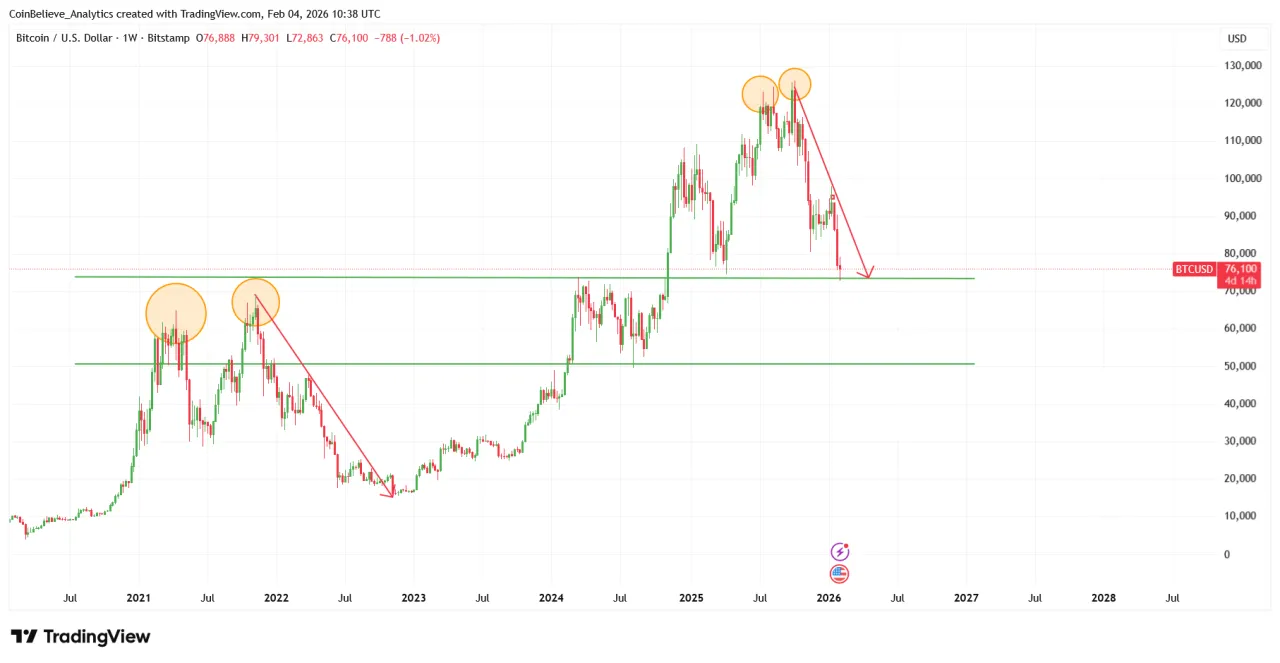
On higher timeframes, Bitcoin shows:
- Two major rejection zones near cycle highs
- A lower high after the second rejection
- Price compressing between major resistance and a well-defined support band
This structure is typical of distribution or consolidation, not immediate bear-market collapse.
Key observations:
- Buyers consistently defend the main support zone.
- Sellers consistently defend the upper range.
- Breakouts lack follow-through.
This creates a horizontal market.
If Bitcoin were entering a 2022-style bear phase, we would already see:
- Clean weekly breaks of major support
- Strong expansion in sell volume
- No meaningful bounces
None of those conditions are present.
Early 2026 shows compression, not structural failure.
How This Differs From the 2022 Crash (68k → 14k)
- The Federal Reserve was in the most aggressive hiking cycle in decades.
- Liquidity was being removed from the system.
- Leverage across crypto lenders and funds was extreme.
- Multiple large entities failed (3AC, Celsius, FTX).
- Support levels failed one after another.
- Bounces were shallow and brief.
- Trend was clearly downward on weekly and monthly charts.
What the Bond Market Is Actually Telling Us
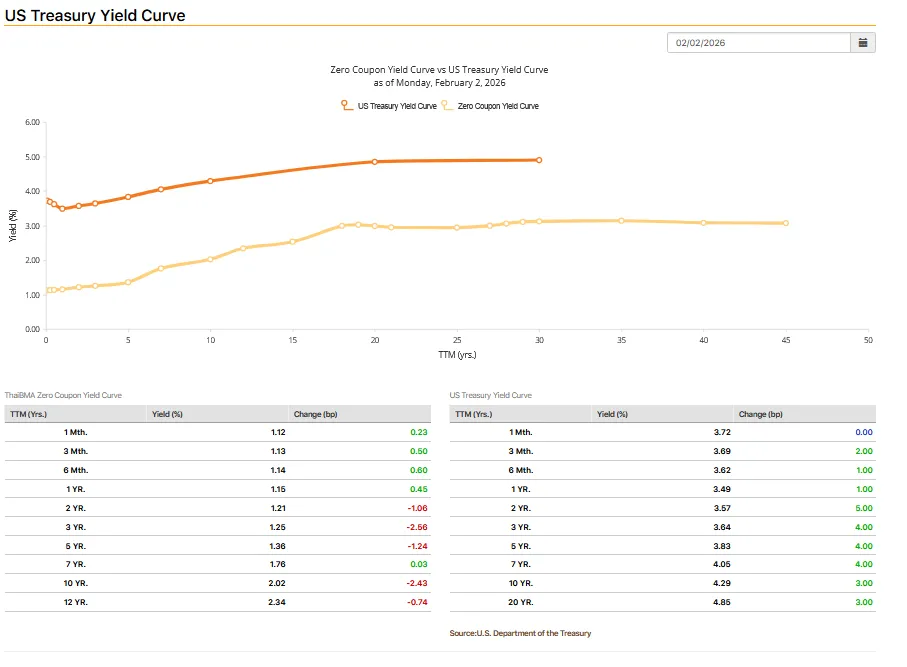
For Bitcoin, this environment is important. Historically, strong and sustained crypto uptrends tend to begin only after long-term yields start trending lower for a period of time. That rollover represents easing financial conditions and expanding liquidity. At present, that rollover has not occurred. Liquidity exists, but it is not expanding. This single condition explains why Bitcoin can still rally on short squeezes yet struggles to maintain upside momentum.
What U.S. Equities Add to the Picture
The U.S. stock index remains near record highs and continues to grind higher rather than accelerate vertically.
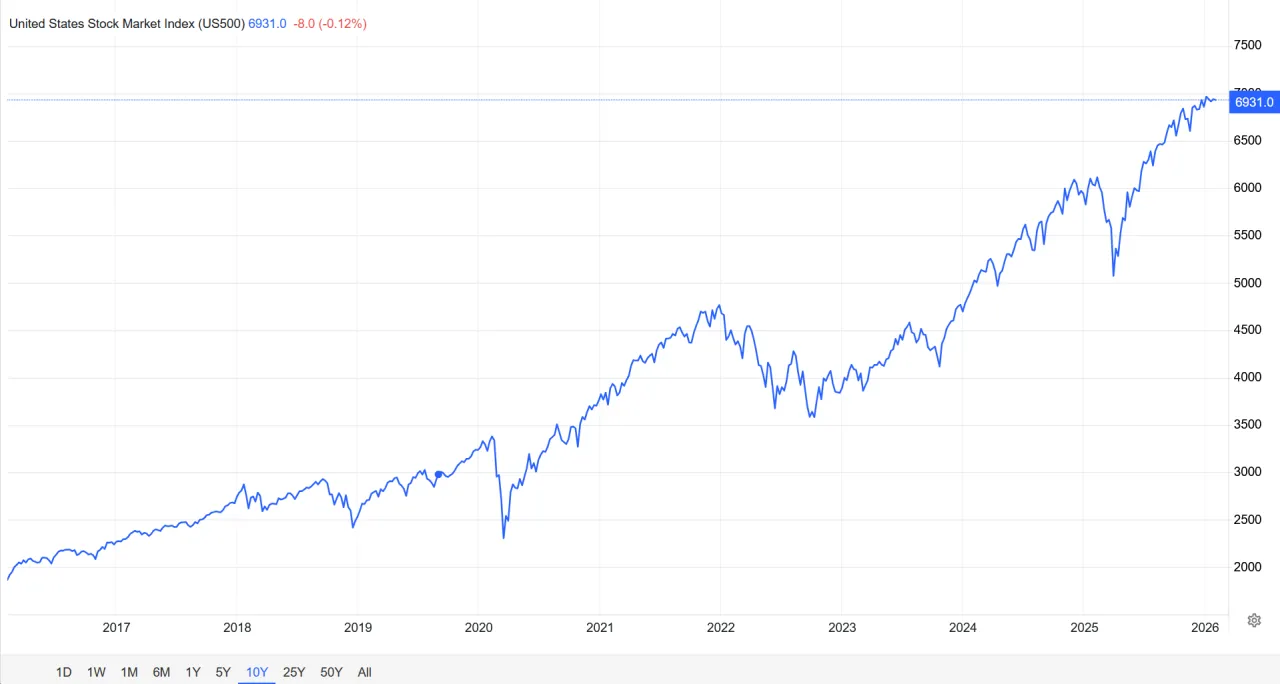
This tells us risk appetite still exists. But it is controlled.
Investors are comfortable holding equities.
They are not aggressively rotating into higher-beta assets.
Historically, Bitcoin performs best when equities are strong and bond yields are falling.
Early 2026 only satisfies one of those conditions.
That is why Bitcoin survives, but does not trend.
Derivatives Still Dominate Price Discovery **
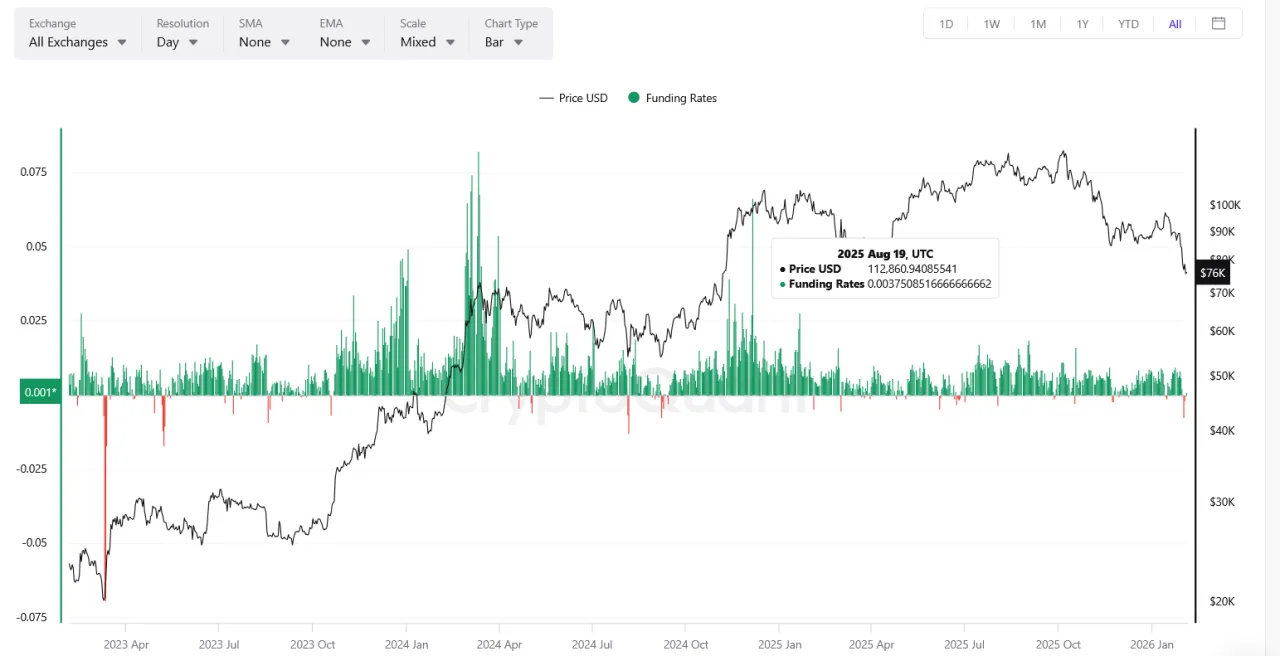
This pattern signals leverage-driven positioning rather than sustained spot accumulation.
Leverage builds → funding rises → price spikes → liquidations → price resets.
ETF Infrastructure Exists, But Macro Still Controls
Ongoing Supply Still Caps Upside
The miner outflow chart shows a simple but important reality.
From 2024 through early 2026, miners have continued to send Bitcoin to exchanges on a regular basis. The outflows are not at crisis levels, and there is no sign of panic selling. But they are steady.
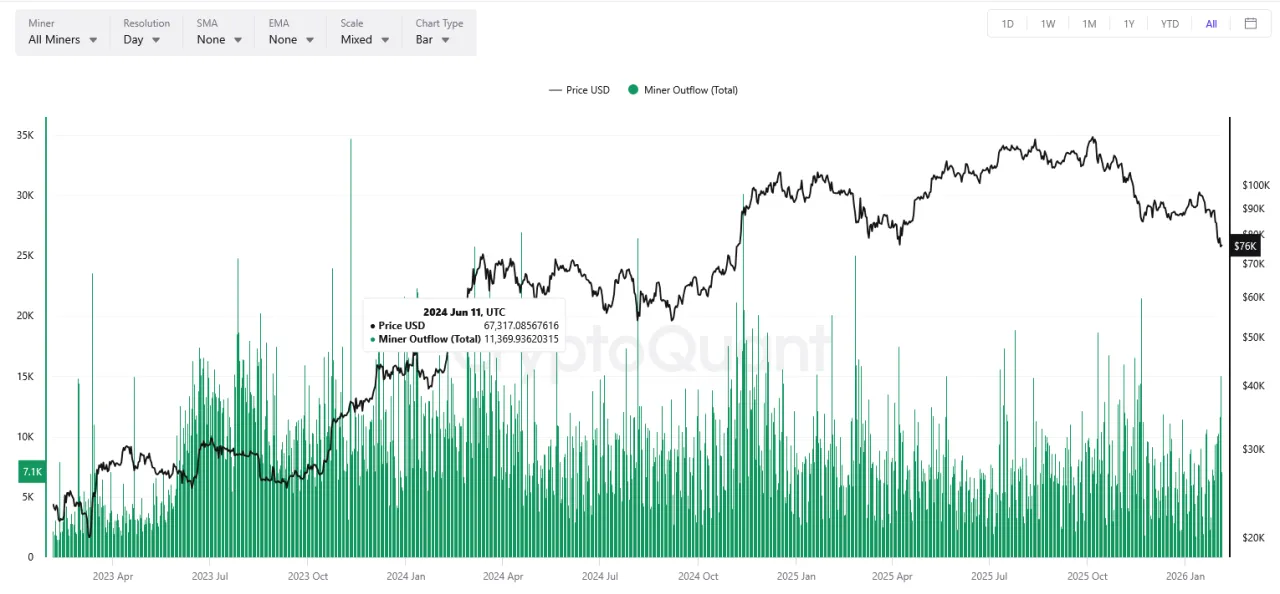
That steady flow matters.
Miners have ongoing expenses. Power, hardware, hosting, and infrastructure upgrades all require cash. Even in neutral market conditions, a portion of mined Bitcoin is routinely sold.
When spot demand is strong, this background supply is easily absorbed. Price trends higher.
When spot demand is inconsistent, as it is in early 2026, this supply becomes visible in the chart.
Rallies start. Rallies slow. Rallies fade.
Not because the market is broken.
Because new demand is not yet strong enough to overwhelm steady supply.
This does not point to a collapse.
It points to friction.
Bitcoin needs sustained spot buying to push through this supply layer. Until that happens, upside progress is likely to remain slow and uneven.
What We Watch Next
The next meaningful inflection points remain macro driven.
U.S. Jobs reports.
U.S. CPI inflation releases.
FOMC rate decisions and forward guidance.
Long-term Treasury yield behavior.
If labor data weakens and inflation continues to cool, markets will begin pricing earlier rate cuts.
Earlier rate-cut expectations pressure yields lower.
Lower yields improve risk appetite.
Improved risk appetite supports Bitcoin.
This is the sequence that historically precedes sustained crypto uptrends.
Final Conclusion
Bitcoin is not repeating 2022.
The chart pattern may visually resemble parts of the 2021–2022 topping process, but the underlying pressure and structure are different.
In 2022, price collapsed under aggressive tightening, rapidly shrinking liquidity, and systemic failures across the crypto industry.
In early 2026, price is compressing under tight liquidity, stable but still restrictive policy, steady structural supply, and unresolved macro and regulatory conditions.
Bitcoin is not in a bull run. Bitcoin is consolidating inside a constrained macro environment.
Early 2026 is best described as a base-building and positioning phase.
U.S. equities remaining near record highs reduce the risk of a deep macro shock. That is positive for Bitcoin from a downside perspective. However, equity strength alone is not enough to generate a crypto bull market. Historically, Bitcoin performs best when equities are strong and long-term yields are falling. Early 2026 only satisfies one of those conditions.
At the same time, miner outflow data shows steady distribution rather than aggressive accumulation. This ongoing background supply does not cause collapse, but it does create friction. Any new demand must first absorb this supply before price can expand higher.
If macro conditions improve — particularly through falling long-term yields and clearer rate-cut expectations — Bitcoin’s structure can rebuild. Improved macro conditions can also reduce passive ETF selling pressure and encourage steadier spot accumulation.
However, a key risk remains.
Each time Bitcoin begins to stabilize or show early improvement, retail leverage tends to return quickly. Excess leverage reintroduces fragility into the market and often weakens the bullish impact of positive macro or policy events.
This combination explains why progress has been slow.
When liquidity expands, yields roll over, miner selling becomes easier to absorb, and spot demand begins to lead derivatives, the next expansion phase becomes possible.
Until then, survival, discipline, and patience matter more than prediction.
#Bitcoin #CryptoMarket #CryptoAnalysis #BTCPrice #CryptoNews #Blockchain #MacroEconomics #DigitalAssets