
Quick Briefing
- Here's the scoop on $PYTH: after a rough slide, it looks like it's successfully bottomed out and built a strong base. We're seeing clear signs of a controlled recovery driven by genuine demand, not just speculative hype.
- The big picture is, the market structure is showing healthy absorption, meaning real buyers are stepping in and soaking up supply. This sets it up nicely for a potential move higher, as long as it continues to hold key levels and isn't being fueled by excessive leverage.
- But, keep your eyes peeled! The main thing to watch out for is if it fails to hold the crucial $0.059-$0.061 support zone; that would invalidate this bullish setup. It also needs to convincingly break above the $0.067-$0.070 resistance for a bigger push upwards.
$PYTH ( Pyth Network) spent several weeks under consistent downside pressure, sliding from the 0.10–0.11 region before sellers finally began to lose control. That shift became visible when price started stabilizing between 0.050 and 0.060. Instead of continuing to bleed, the market began forming a base. Volatility compressed, downside follow‑through weakened, and bids repeatedly stepped in. This zone marked the transition from decline into accumulation.
The subsequent move was not random. Price lifted from 0.054–0.055 and expanded toward 0.065 with strong candles and limited upper wicks. Pullbacks were shallow and quickly bought. This type of price behavior typically reflects genuine demand rather than short‑lived speculation. On the 4H chart, PYTH broke the descending trend that had capped price since the 0.11 area and printed a clear higher high. That is the first structural signal that the bearish trend has weakened. On the daily timeframe, the trend has not fully flipped bullish, but the base between 0.05–0.06 is now well defined and defended.
From a structural point of view, $PYTH appears to be in a transition phase, and the 4H chart makes this very clear. Price is now trading inside a short-term ascending channel that started forming after the Dec 18–19 lows. The lower boundary of this channel connects the capitulation low near 0.053–0.054 with the higher low printed around 0.055–0.056 at the start of January. This trendline has been respected cleanly, showing that buyers are defending higher levels.
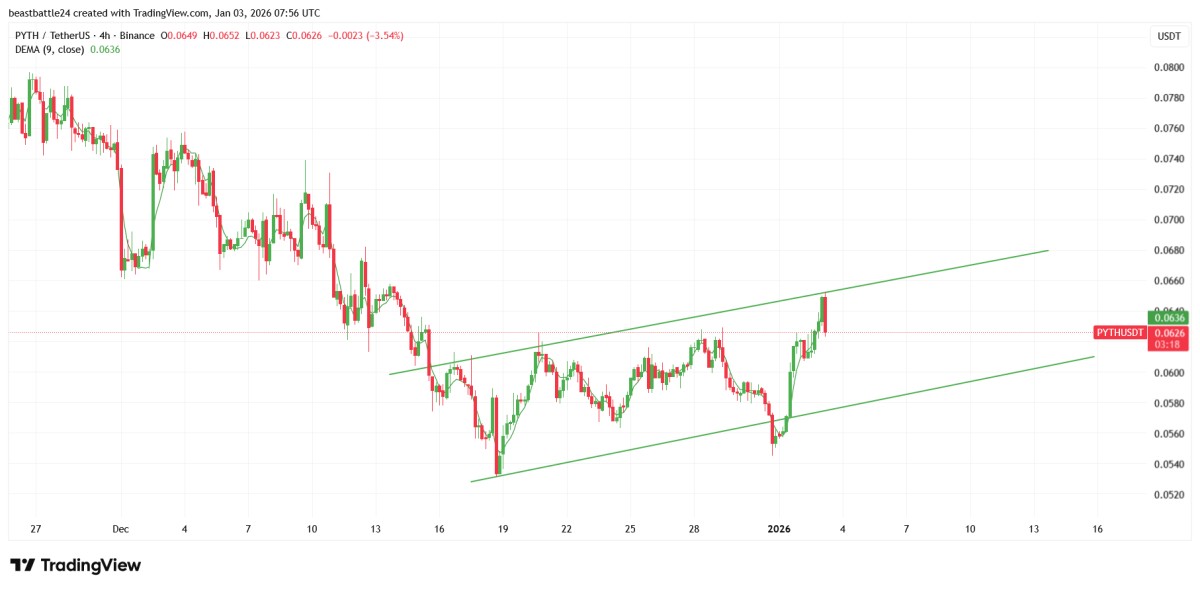
Source: TradingView
The upper boundary of the channel is now properly defined by real swing highs rather than projection. It connects the Dec 22–23 reaction high with the recent push toward 0.065–0.066. This makes the structure valid and actionable. At the moment, price is trading close to the upper channel resistance, which explains the recent hesitation and upper wicks. This is normal behavior at resistance and does not invalidate the structure by itself.
As long as price remains inside this rising channel, the market is in a controlled recovery phase. Acceptance and a clean 4H close above the upper boundary, around 0.067, would signal expansion and open the door toward the 0.075–0.085 zone. A rejection from the upper boundary would likely lead to a pullback toward the middle or lower part of the channel, with 0.061–0.062 acting as the most important area to hold. Only a sustained break below 0.059 would damage the channel structure and shift the bias back toward weakness.
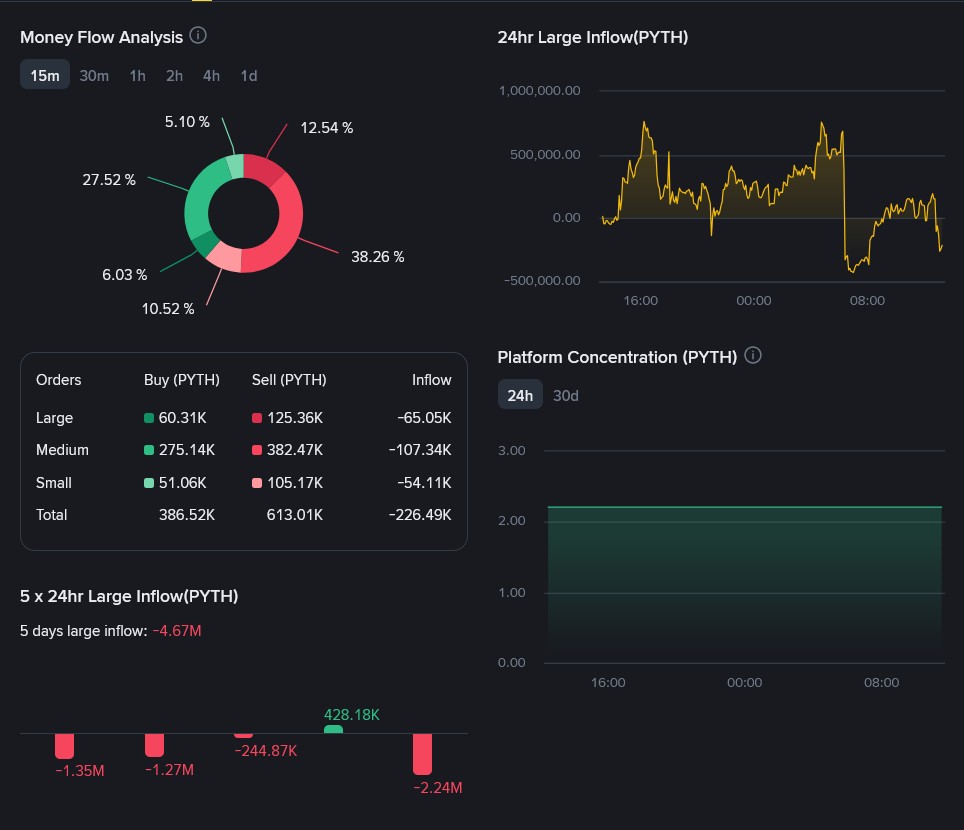
Money flow data explains why price has not faded after the rally. Large‑order flow shows approximately 8.5–9 million $PYTH sold versus 6.5–7 million $PYTH bought, resulting in a net large‑order sell pressure of roughly 1.5–2 million $PYTH. At the same time, medium and small orders absorbed more than 2 million $PYTH on the buy side. This balance matters. Larger participants are taking profit into strength, but their supply is being absorbed rather than rejected. If aggressive distribution was taking place, price would struggle to remain above 0.062.
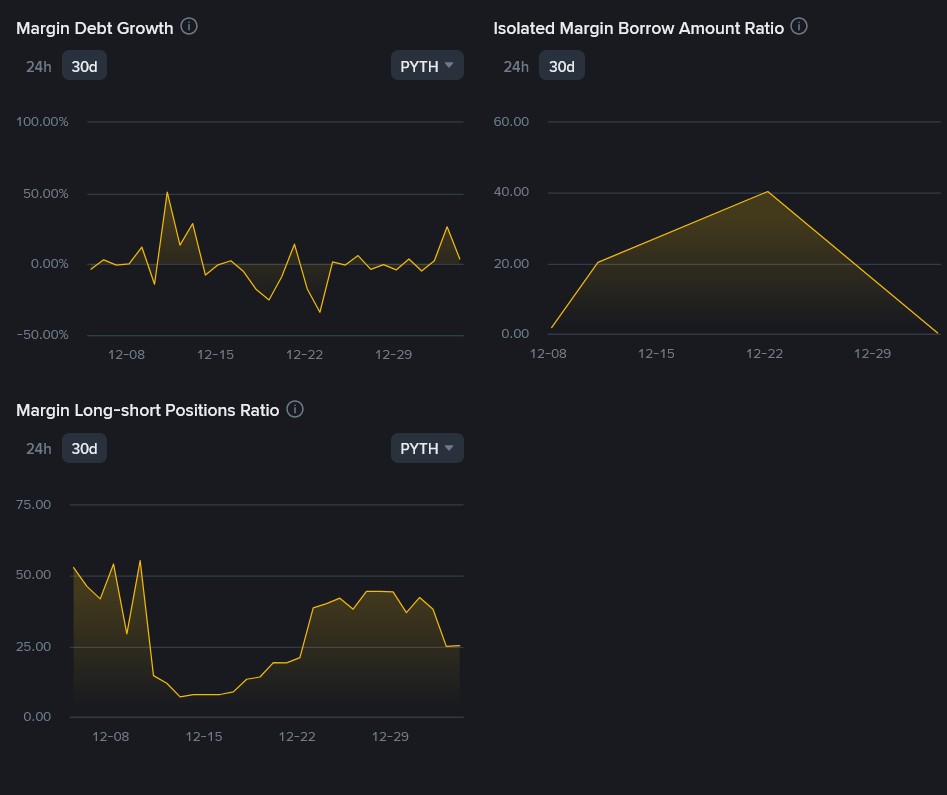
Leverage behavior supports this interpretation. Over the past 30 days, margin debt did not spike during the rally. Long positions increased after price expansion rather than before it, and isolated borrowing activity cooled shortly after. This indicates the move was driven primarily by spot demand rather than excessive leverage, reducing the risk of forced liquidations during pullbacks.
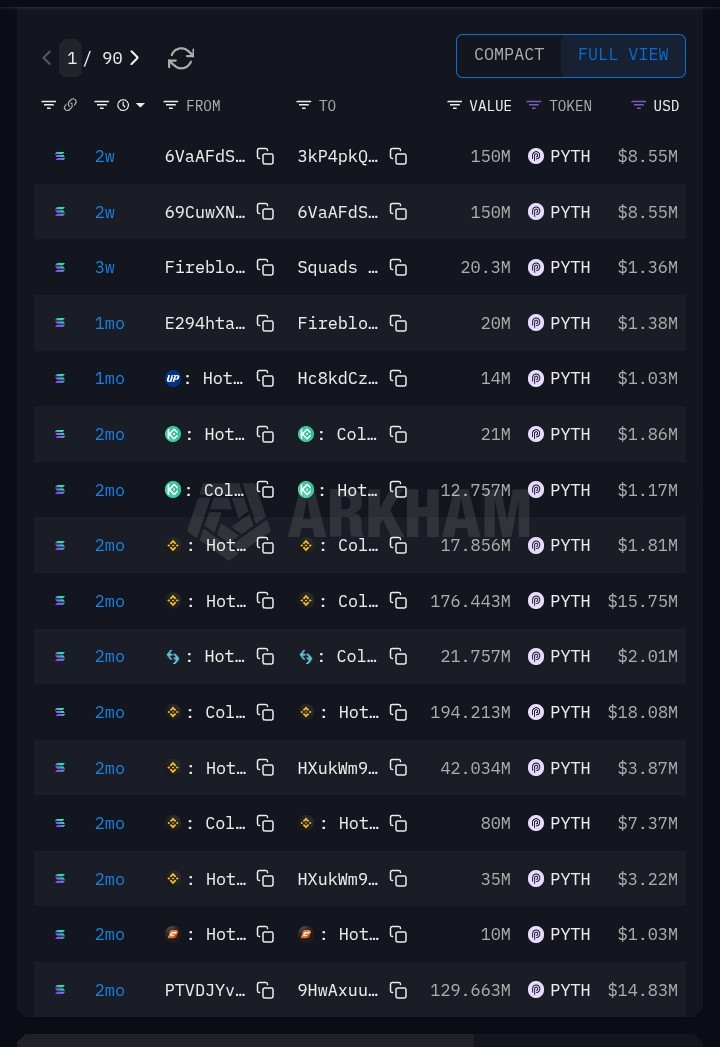
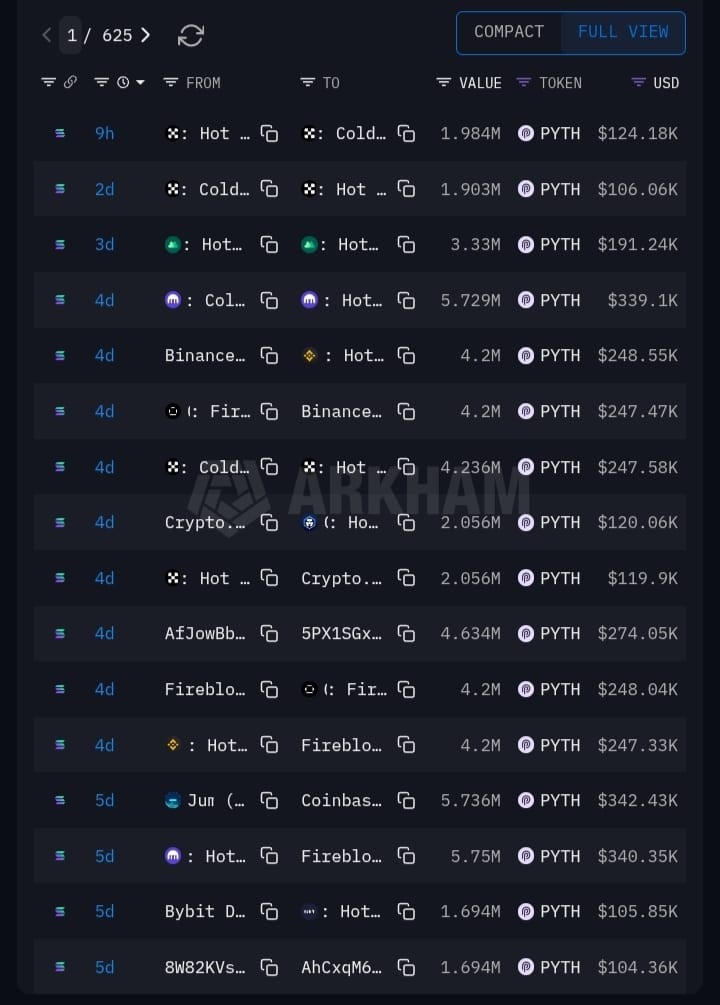
Whale transfer data adds important context when viewed correctly. Most of the larger whale movements — transfers in the 2M–6M $PYTH per transaction range — occurred one to two weeks ago, not during the most recent sessions. In total, roughly 15–20 million $PYTH rotated across tracked whale wallets during that earlier period. These transfers were spread out over time and often involved partial exchange deposits rather than full wallet unloads. Recent sessions have shown noticeably weaker whale activity, with no fresh large exchange inflows. This suggests whales are currently passive rather than actively positioning for a breakdown.
On the supply side, there is no immediate token unlock pressure impacting the market. On the demand side, the project continues expanding institutional‑grade data products and value‑capture mechanisms tied to real usage. While fundamentals do not dictate short‑term price action, they help explain why buyers continue to absorb supply during dips.
Key price levels are now clearly defined. The 0.061–0.062 zone is the most important short‑term support. As long as price holds above this range, the short‑term bias remains bullish. The primary decision zone lies between 0.067 and 0.070. Sustained acceptance above this area would signal continuation and open the path toward 0.075–0.085. Failure to hold support, followed by a daily close below 0.059, would invalidate the bullish setup and shift the bias back to neutral or bearish.
Looking further ahead, if daily and weekly structure continue to improve and broader market conditions remain supportive, PYTH has room to work toward the 0.09–0.10 region over the mid term. This scenario depends on continued absorption, stable leverage conditions, and follow‑through above resistance.
Overall, $PYTH is not showing signs of panic distribution or leverage‑driven excess. The market is displaying controlled strength, measurable absorption, and clearly defined risk levels. Short‑term bias leans bullish above support, while mid‑term continuation depends on confirmation at key resistance zones.

About Meow Alert
Crypto analyst and researcher with 13k+ followers on Binance Square. Focused on on-chain data and market structure.
Intelligence Stream
BTC Near $80K — Data Shows Liquidity Build, But Macro Is Holding It Back
21 Reads
Author Update
Europe’s Rate Hike Signal: A Liquidity Shift That Crypto Markets Are Underestimating
22 Reads
Author Update
Trump Loses Tariff Power: Why This Could Trigger the Next Crypto Bull Run
29 Reads
Author Update
📢 Official Announcement — CoinBelieve Monetization Is Live
56 Reads
Most Viewed